 User Guide
Geo Map
This note type displays the children notes on a geographical map, based on an attribute. It is also possible to add new notes at a specific location using the built-in interface.
Features#
- Add markers on the map, which can be customized with icons, colors and text.
- Search the notes already on the map, and look up places anywhere in the world.
- Turn a place the map already shows into a marker by clicking it.
- Draw paths, areas, rectangles and circles onto the map.
- Display tracks on the map using
.gpxfiles. - Show your own location on the map and follow it as you move.
- 3D view of the map, which displays buildings when using a vector map.
System requirements#
Starting with v0.105.0, the geomap uses MapLibre GL which requires WebGL v1 support. In general, most devices will support it because browsers/Electron can render it in software if needed.
If the map could not be drawn because WebGL could not be initialized, an error message will appear instead of the map (This map can't be drawn because WebGL isn't available…).
The button that shows your location is offered only when Trilium is reached over HTTPS, in the desktop application or in the mobile application. Browsers refuse to share the location of a device with a page served over plain HTTP, so on such a server the button does not appear.
Interaction#
- At the top-left there is the search bar. It searches the notes already on the map, and it can also search for places online when you ask it to. While you move through the results of a search, a counter with previous and next buttons appears under it.
- At the bottom-center there is a central toolbar which provides editing features: adding new markers on the map and importing GPX tracks.
- At the bottom-right there are the viewport items:
- Zoom in/out
- On mobile these are hidden, use pinch to zoom instead.
- On desktop, alternatively use the scroll wheel to adjust the zoom.
- A button that shows your location on the map and follows it (see Going to your location below).
- Full screen button which focuses the entire map onto the screen, while still allowing for edits.
- Zoom in/out
- At the top-center (on desktop, or left-center on mobile and in split views) there are the drawing tools such as paths, areas, rectangles and circles.
- When the map is read-only, the toolbar is not shown.
Creating a new geo map#
Right click on an existing note in the Note Tree and select Insert child note → Geo Map.
By default the map will be empty and will show the entire world.
Repositioning the map#
- Click and drag the map in order to move across the map.
- Use the mouse wheel, two-finger gesture on a touchpad or the +/- buttons on the bottom-right to adjust the zoom.
The position on the map and the zoom are saved inside the map note and restored when visiting again the note.
A map that has no position saved yet is framed around the markers it contains when you open it, so they are all in view without having to go looking for them. A map that contains no markers shows the whole world instead.
In practice this applies to maps whose markers were added externally, by a script or through ETAPI (REST API). When you add markers yourself you have already moved the map to reach the place you are marking, and that movement saves a position.
Going to your location#
Press the Show your location button at the bottom-right of the map, beside the zoom buttons. The first time, the browser or the operating system asks whether Trilium may know where the device is. In the desktop application the operating system's location settings decide.
The map then moves to where the device is and marks it with a blue dot. A lighter circle around the dot shows how accurate the position is: a phone with GPS gives a dot on the street, while a computer located through its network connection can give a circle that covers a neighbourhood. The map follows the dot as it moves, and the button stays pressed while it does.
Dragging the map stops it from following. The dot stays and keeps moving, and pressing the button again brings the map back to it. Pressing the button while the map is following turns the dot off.
Click the dot to see its coordinates in the panel a searched place is shown in. From there the position can be kept as a marker (see Keeping a place as a marker). Clicking the lighter circle around the dot is a click on the map.
If the position cannot be found, a message says so and the button keeps waiting for one; press it again to stop. If you refuse the permission, the button is disabled until the map is opened again. To allow it after all, change the permission for Trilium in the browser or in the system's location settings.
Your position is not stored in the note, and Trilium does not send it anywhere on its own. Moving the map there does what any other pan or zoom does: the tile provider behind the map's style sees the coordinates of the area now on screen. The map does remember where you left it, as it does after any other movement, so a map you have taken to your location opens there the next time.
Searching the map#
The search bar at the top-left of the map searches in two places. It always searches the notes that are already on the map. It can also search for places online, but only when you ask it to.
Searching the notes already on the map#
Type in the search bar, and the notes on the map are matched by their title as you type. Accents are ignored, both in what you type and in the titles, so zurich finds Zürich Hauptbahnhof. Each word is searched for on its own, so hotel paris finds Paris Hotel. Notes without a #geolocation attribute are not offered, since there would be nowhere to go. Drawn shapes and GPS tracks are offered, even though they carry no such attribute: selecting one brings the whole shape or route into view.
If more notes match than the list can show, you are offered the ones closest to the area you are viewing.
Searching for places online#
Looking up a place sends what you typed to a third-party service. For this reason, it never happens while you type. Instead, the last row of the result list offers the search. That row reads Search online for "…", with the name of the service below it. The search runs only when you press that row or select it with Enter.
Trilium uses Nominatim, the place search run by the OpenStreetMap Foundation. It needs no account and no API key. Its name is shown on every row that belongs to it: the row that offers the search, the row that says a search is running, and the row that reports that nothing was found or that the service could not be reached.
The search prefers the area you are viewing. Places inside the current view are searched for first and listed above the others. If you search for a shop while looking at your own town, you therefore find the branch in that town, and not one with the same name on another continent. The view is always treated as at least 25 km across, so a search made while zoomed into a single street still covers the town around it.
Going to a point#
If you type or paste coordinates into the search bar, a Go to row is offered above all the other results. Selecting it moves the map to that exact spot and marks it. You can then keep it as a marker, in the same way you keep a place found by searching.
Points are untitled by default; the corresponding note opens with the default name selected so it can be easily replaced. If the map has a Default Note Title label, the marker is named by that template instead.
The supported forms are:
- A plain pair, such as
45.9432, 24.9668. This is what Google Maps and OpenStreetMap both give you when you ask for the coordinates of a place, and it is also what the#geolocationattribute holds. - The
geo:link that the map itself offers for a place, through the Open location action. - The address of a place on Google Maps or OpenStreetMap, pasted whole.
A pair that is not a place on Earth, such as 1234, 5678, is not offered.
Reading the results#
Results are gathered under headings, and each group is ordered by distance from the middle of the map:
- On this map: notes that are already on the map, whatever their distance.
- Nearby: places found within about 25 km of the view.
- Far away: all the other places.
The headings only appear when at least two of the three groups contain something. Every row that has a position shows how far away it is, in kilometres or miles according to your locale. A place found online shows its name on the first line and its address on the second.
Selecting a result#
Selecting a note already on the map moves to its marker and opens the note beside the map, as clicking the marker would.
Selecting a place found online moves the map to it and marks it with a temporary pin. The pin has a different color from the map's own markers. The map is fitted to the area that the place covers, so a country fills the view, while a house is shown at street level. Some places have a boundary, such as a country, a county or a park. When the service reports one, that boundary is outlined under the pin.
A panel then opens with the place's full address and its coordinates: in the top-right corner on desktop, and at the bottom of the map on mobile, where the top is kept for the search bar and the result counter. Pressing the coordinates copies them to the clipboard.
Keeping a place as a marker#
Press Add as marker in that panel to keep the place. A child note is created under the map. It takes the name of the place, as well as the icon, which matches the kind of place it is. Its #geolocation attribute is already set. The note opens beside the map, so you can edit it straight away. The temporary pin disappears, because the place is now a marker like any other.
The button is not offered on a map that cannot be edited, where the panel can still be read.
Press the panel's close button, or the Escape key, to send the place away without keeping it. The pin goes with it.
Stepping through the results#
Once you select a result, a counter appears under the search bar, with a previous and a next button. These buttons move through everything the search offered, in the order it was listed. You can therefore compare several results without opening the list again. Pressing the counter itself moves the map back to the current result, which is useful after you have moved the map away from it.
The keyboard#
- Enter runs the online search when its row is the one selected, and otherwise moves to the highlighted result. Pressed after a result has been taken, it brings the list back.
- Escape closes the result list, and closes the place panel.
- Returning to the search bar reopens the list it was showing.
- The X at the end of the bar empties it, which also takes a searched place, its pin and its panel off the map.
Adding a marker using the map#
Adding a new note using the plus button#
To create a marker, first navigate to the desired point on the map. Then press the Add marker button at the center-bottom of the map.
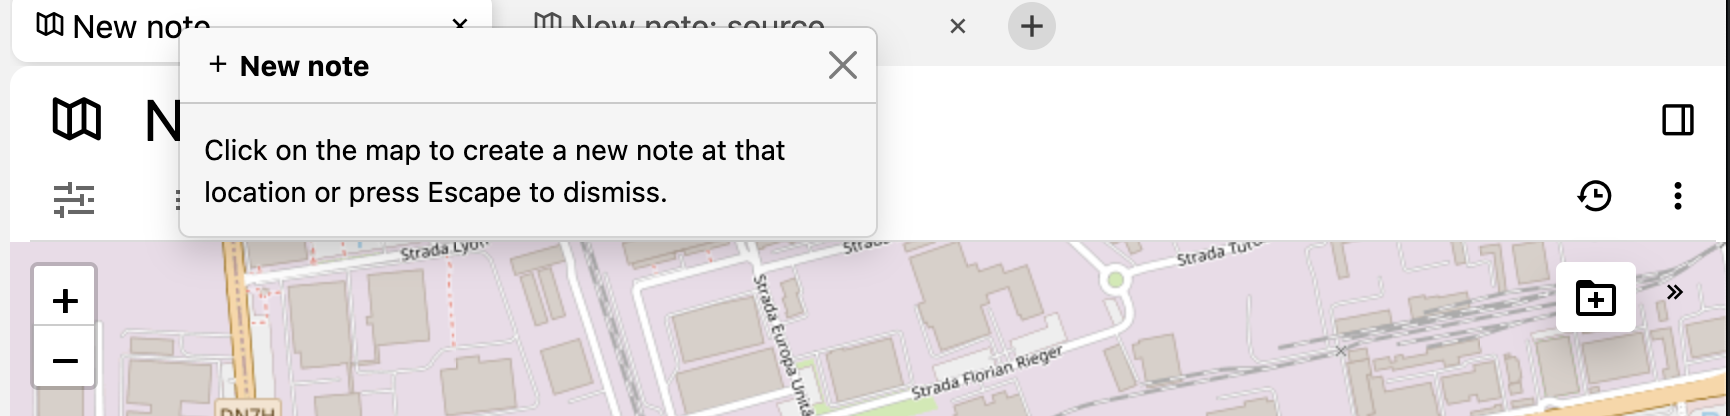
Once pressed, the map will enter in the insert mode, as illustrated by the notification. Additionally, a preview of the marker will be shown at the cursor position.
Simply click the point on the map where to place the marker. To cancel, press either the Escape key or press again the Add marker button.
Once clicked, the marker will show up on the map and a popup will show to the right with the title already selected to be changed.
Adding a new note using the contextual menu#
- Right click anywhere on the map, where to place the newly created marker (and corresponding note).
- Select Add a marker at this location.
- Once clicked on a position on the map, the marker will show up on the map and a popup will show to the right with the title already selected to be changed.
Adding an existing note from the note tree#
- Select the desired note in the Note Tree.
- Hold the mouse on the note and drag it to the map to the desired location.
- The map should be updated with the new marker.
This works for:
- Notes that are not part of the geo map, case in which a clone will be created.
- Notes that are a child of the geo map but not yet positioned on the map.
- Notes that are a child of the geo map and also positioned, case in which the marker will be relocated to the new position.
Adding a note from a place the map already shows#
When a vector map style is used, the map itself draws the shops, cafés, museums and other places around the area being viewed. Once the map is zoomed in far enough for these to be drawn, they can be clicked:
- Look for the places drawn in orange. This is the same color used for a place found by searching. These are the places you can click. They are drawn almost solid, while the other places on the map stay a faint grey.
- Rest the mouse on one of them. Its name appears above it, and the mouse cursor changes to a pointer. The map draws these places as icons without names, so you read a name by hovering over it. If all the names were shown at once, they would crowd out the titles of your own markers.
- Click it. The same panel used for a place found by searching appears. It shows the name of the place and its coordinates, and a pin is placed on the map.
- Press Add as marker to keep it. The note is created with the name of the place as its title, and with the icon that matches the kind of place it is.
Places are read from the map data that has already been downloaded, so clicking one does not send anything to the internet.
Some things to keep in mind:
- Places with no name in the map data, such as benches or parking spaces, show no name and cannot be clicked. Clicking them does nothing, just like clicking an empty part of the map.
- The map's own markers come first. If a marker covers a place, clicking it opens the note and not the place.
- This does not work with the raster (OpenStreetMap) style, because its places are part of the map image. It also does not work with the Neutrino style, which draws no places.
- In read-only mode you can still click a place and read it, but you cannot keep it as a marker.
How the location of the markers is stored#
The location of a marker is stored in the #geolocation attribute of the child notes:
This value can be added manually if needed. The value of the attribute is made up of the latitude and longitude separated by a comma.
Repositioning markers#
Once a marker is set, it can be repositioned using one of the two ways:
- By right clicking the marker and selecting Move to another location.
- By clicking the marker to open the popup and selecting the Move to another location button underneath the title bar.
After clicking the button to move the marker, click at the desired position on the map to replace it. To cancel the operation, press Escape.
Interaction with the markers, tracks or shapes#
- Hovering over a marker will display a Note Tooltip with the content of the note it belongs to.
- Clicking on the note title in the tooltip will navigate to the note in the current view.
- Right-clicking the marker will open a contextual menu (as described below).
- Clicking a marker will focus on the marker and display a dedicated popup with the details. This works regardless of whether the map is editable or not.
Popup view#
When a marker, a shape, or track is clicked, a popup will open to the right which contains the following information:
- The title and icon of the marker, both editable.
- An indicator for the coordinates; clicking it will copy the coordinates to clipboard.
- A button to maximize the popup.
- Buttons to interact with the current item:
- Open the marker in the same pane, new tab, etc.
- A button to open the location in a dedicated application (e.g. Google Maps on mobile).
- Color picker to change the color of the marker.
- Markers can also be moved, unlike tracks or shapes (which need to be redrawn).
- Button to remove the marker from the map, which can optionally delete its corresponding note.
- Removing a marker without deleting the note will only remove its
#geolocationattribute (case in which the coordinates have to be manually added back in in order to get the note to show on the map again). - Similarly, removing a shape will remove its
#geoShapeattribute.
- Removing a marker without deleting the note will only remove its
- The Promoted Attributes of the marker, if any.
- The note's content which can be edited directly from the panel.
To dismiss the popup:
- Press the X button at the top-right of the popup.
- In the map, press anywhere outside the popup.
- Or simply press the Escape key.
When a marker is clicked, the map will automatically adjust the viewport so that the marker is still visible with the popup open. The currently selected marker is shown slightly bigger.
It is possible to switch between markers by clicking on them even when the popup view is already open.
Markers can have Internal (reference) links between them and clicking on such a link will automatically adjust the viewport and the popup view to the new note.
Contextual menu#
It's possible to press the right mouse button to display a contextual menu.
- If right-clicking an empty section of the map (not on a marker), it allows to:
- Displays the latitude and longitude. Clicking this option will copy them to the clipboard.
- Open the location using an external application (if the operating system supports it).
- Adding a new marker at that location.
- If right-clicking on a marker, it allows to:
- Displays the latitude and longitude. Clicking this option will copy them to the clipboard.
- Open the location using an external application (if the operating system supports it).
- Open the note in a new tab, split or window.
- Button to remove the marker from the map, which can optionally delete its corresponding note. Removing a marker without deleting the note will only remove its
#geolocationattribute (case in which the coordinates have to be manually added back in in order to get the note to show on the map again).
- Shapes can also be right-clicked and the menu is similar to markers except they cannot be moved.
Icon and color#
The markers will have the same icon as the note.
It's possible to add a custom color to a marker by assigning them a #color attribute such as #color=green.
This also applies to tracks and shapes.
Adding the coordinates manually#
Searching for the place is usually quicker (see Searching the map above). The steps below remain useful for a coordinate that is already to hand, or for a place the search cannot find.
In a nutshell, create a child note and set the #geolocation attribute to the coordinates.
The value of the attribute is made up of the latitude and longitude separated by a comma.
Adding from Google Maps#
- In Google Maps, on the web:
- Look for a desired location, right click on it and a context menu will show up.
- Simply click on the first item displaying the coordinates and they will be copied to clipboard.
- In Trilium, create a child note under the map.
- Then paste the value inside the text box into the
#geolocationattribute of a child note of the map (don't forget to surround the value with a"character).
Adding from OpenStreetMap#
Similarly to the Google Maps approach:
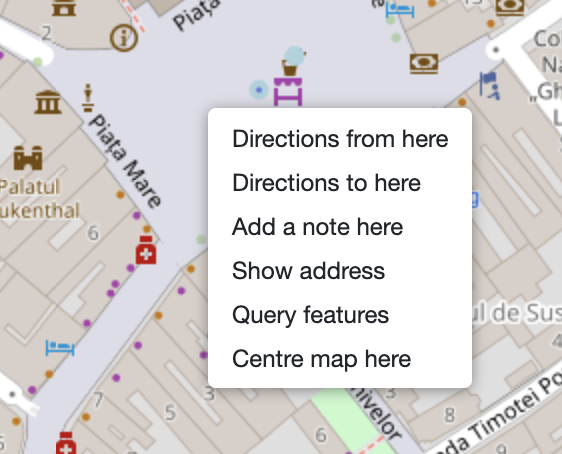
- Go to any location on openstreetmap.org and right click to bring up the context menu. Select the Show address item.
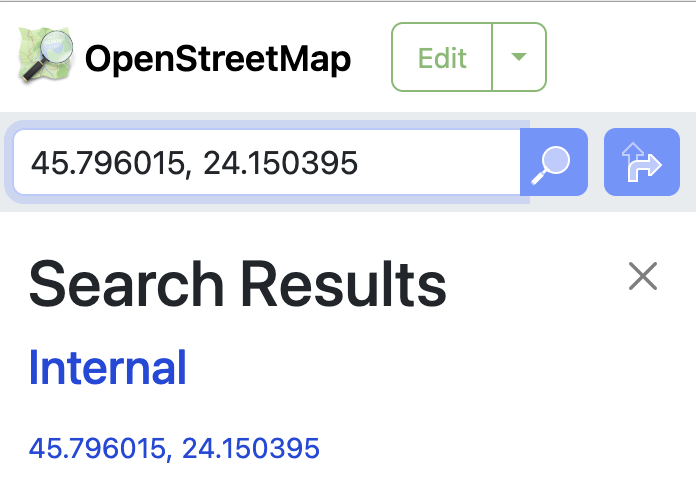
- The address will be visible in the top-left of the screen, in the place of the search bar. Select the coordinates and copy them into the clipboard.
- Simply paste the value inside the text box into the
#geolocationattribute of a child note of the map and then it should be displayed on the map.
Drawing shapes on the map#
See the dedicated Drawing shapes page.
Adding GPS tracks (.gpx)#
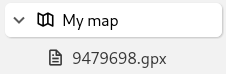
Trilium can display GPS tracks on the geo map, in the form of .gpx files.
To add a track, either:
- Drag & drop a
.gpxfile inside the geo map in the note tree.- In order for the file to be recognized as a GPS track, it needs to show up as
application/gpx+xmlin the File type field.
- In order for the file to be recognized as a GPS track, it needs to show up as
- Press the Add a GPS track from a GPX file which will directly prompt for a GPX file and import it as a subnote of the collection.
When going back to the map, the track should now be visible.
The starting point of the track will be displayed as a marker, with the name of the note underneath. The start marker will also respect the icon and the color of the note. The end marker is displayed with a distinct icon.
If the track file contains multiple tracks, they will all be displayed as well as markers. Trilium will also split a single track that happens to have non-continuous points.
If the GPX contains waypoints, they will also be displayed, including their names.
When the track is clicked, the entire route is brought into view, as well as the right popup will indicate details about the track such as distance, duration and the elevation map. This information is also displayed when clicking the .gpx note itself.
When clicking on the markers of a track (whether it's the start or stop builtin markers, or custom markers that are part of the track), only that marker is brought into view, as opposed to the entire route.
Read-only mode#
When a map is read-only all editing features will be disabled such as:
- The add button at the bottom of the map.
- Repositioning markers.
- Editing from the contextual menu (removing locations or adding new items).
- Keeping a place as a marker, whether you found it by searching or clicked it on the map. You can still search and click, and you can still look at a place and copy its coordinates.
- Drawing shapes.
To set a map as read-only, go to Note buttons → Editable → Read-only (on the new layout, or in Basic Properties on the Ribbon for the old layout).
Configuration#
Map Style#
The styling of the map can be adjusted in the Collection Properties or manually via the #map:style attribute.
The geo map comes with two different types of styles:
- Raster styles
- For these styles the map is represented as a grid of images at different zoom levels. This is the traditional way OpenStreetMap used to work.
- Zoom is slightly restricted.
- Currently, the only raster theme is the original OpenStreetMap style.
- Vector styles
- Vector styles are not represented as images, but as geometrical shapes. This makes the rendering much smoother, especially when zooming and looking at the building edges, for example.
- The map can be zoomed in much further.
- These come in various styles that are both light (Colorful, Graybeard, Neutrino) and dark (Eclipse, Shadow).
- The vector styles come from VersaTiles, a free and open-source project providing map tiles based on OpenStreetMap.
- The VersaTiles layers also provide 3D building information (see below).
The default theme is Versatiles Colorful (vector).
3D view with buildings#
Trilium v0.105.0 introduces a 3D view, courtesy of MapLibre GL. To enter 3D mode, simply press the corresponding button at the bottom-right of the map or press Ctrl and drag across the map.
The buildings will only appear from zoom 14 onwards to avoid lag.
Custom map style / tiles#
Starting with v0.102.0 it is possible to use custom tile sets, but only in raster format.
To do so, manually set the #map:style label to the URL of the tile set. For example, to use Esri.NatGeoWorldMap, set the value to https://server.arcgisonline.com/ArcGIS/rest/services/NatGeo_World_Map/MapServer/tile/{z}/{y}/{x}.
Additionally:
- Hi-DPI tiles are supported via the
{r}placeholder. - To mark the custom style as dark (which affects the styling of the UI), apply the
map:darkStylelabel. This attribute also overrides builtin themes.
Custom vector map support is planned, but not yet implemented.
Other options#
The following options can be configured either via the Collection Properties, by clicking on the settings (Gear icon). Alternatively, each of these options also have a corresponding label that can be set manually.
- Scale, which illustrates the scale of the map in either kilometers or miles in the bottom-left of the map.
- The unit is determined by the Formatting locale option in Language & Region.
- The name of the markers is displayed by default underneath the pin on the map. Since v0.102.0, it is possible to hide these labels which increases the performance and decreases clutter when there are many markers on the map.
- v0.105.0 also introduces a feature called Group nearby markers which will cluster multiple markers together at low zoom.
- The clusters display the number of items they contain. The color also changes based on the count.
- Clicking on a cluster will automatically zoom in so that the individual markers that make up the cluster are now visible.